rdEEG uses a two-part setup: an Arduino sketch that reads and transmits biosignal data over Wi-Fi, and a Python script on your computer that receives and visualises it in real time. All scripts are available on GitHub (opens in a new tab).
Step 1 — Upload the Arduino Sketch
Open the Arduino sketch in the Arduino IDE and find the following lines near the top of the file:
char ssid[] = "Wifi Name";
char pass[] = "password";
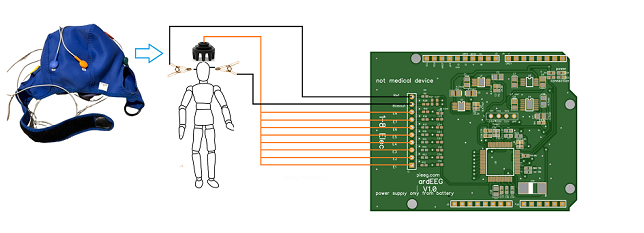
Replace Wifi Name and password with your own Wi-Fi network credentials. Then connect your Arduino UNO R4 to your computer via USB and upload the sketch. Once uploaded, disconnect the USB cable and power the Arduino from your 5V battery only. Do not use a PC USB port or mains adapter during measurements.
Step 2 — Run the Python Script
On your computer, run the Python visualisation script. It connects to the Arduino over Wi-Fi and displays the incoming biosignal data as a real-time graph with a band-pass filter applied.
Make sure your computer is connected to the same Wi-Fi network as the Arduino before running the script.
Step 3 — Verify the Signal
Once both scripts are running you should see a live graph of the EEG, EMG, or ECG signal. If no data appears, check that:
The Arduino is powered on and connected to Wi-Fi Your computer is on the same network The correct Wi-Fi credentials were entered before uploading the sketch