Software
PiEEG-16 works with two software stacks. Pick the one that fits what you want to do.
| Best for | Language | Effort | |
|---|---|---|---|
| PiEEG Server | Live dashboard, recording, streaming to apps, LSL, VRChat, webhooks | Any (WebSocket JSON) | One command |
| Python SDK scripts | Learning how two ADS1299 chips work together, custom register settings, raw data | Python | Edit and run a script |
BrainFlow's PIEEG_BOARD supports the 8-channel PiEEG only. To use PiEEG-16 with tools like OpenViBE, MNE or BCI2000, stream it from PiEEG Server over LSL.
PiEEG Server (recommended)
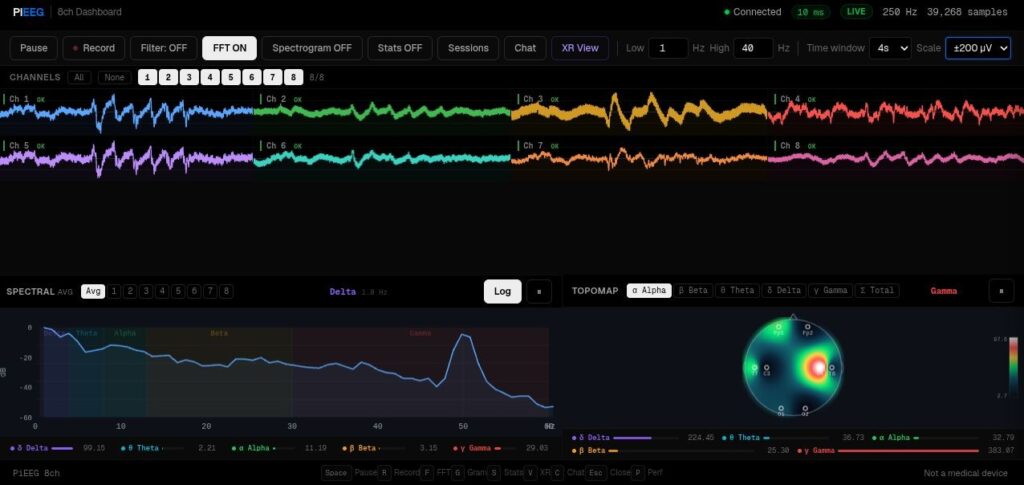
PiEEG Server reads both chips, joins them into one 16-channel stream, filters the signal and serves a browser dashboard plus a real-time data stream. PiEEG-16 is its default device.
# install (first time only)
curl -sSL https://raw.githubusercontent.com/pieeg-club/PiEEG-server/main/install.sh | bash
sudo reboot

# run
pieeg-server # same as: pieeg-server --device pieeg16| Address | What it is |
|---|---|
http://raspberrypi.local:1617 | Browser dashboard |
ws://raspberrypi.local:1616 | WebSocket stream: JSON frames with 16 channels in µV |
Common options
pieeg-server --filter                       # 1–40 Hz band-pass
pieeg-server --record session.csv           # record while streaming
pieeg-server --lsl                          # Lab Streaming Layer outlet
pieeg-server --osc                          # VRChat OSC bridge
pieeg-server record session.csv --duration 300   # 5-minute CSV, no server
pieeg-server monitor                        # live view in the terminal
pieeg-server doctor                         # check SPI, GPIO and settings
The installer also creates a service that starts the server on every boot. If you run it by hand, stop the service first: sudo systemctl stop pieeg-server.
Read the stream from Python
import asyncio, json, websockets

async def main():
    async with websockets.connect("ws://raspberrypi.local:1616") as ws:
        async for msg in ws:
            frame = json.loads(msg)          # {"t": ..., "n": ..., "channels": [16 values in µV]}
            print(frame["n"], frame["channels"])

asyncio.run(main())
More: Quick Start · Configuration · WebSocket API · LSL · Recording
Python SDK scripts
Self-contained Python scripts that set up both ADS1299 chips, read raw samples over SPI and plot or save them.
Source: github.com/pieeg-club/PiEEG-16 (opens in a new tab)
Which script
| Script | What it does |
|---|---|
GUI/pieeg16_drdy_only.py (opens in a new tab) | Start here. Live 16-channel graph with band-pass filter. Reads each chip on its own DRDY line. |
GUI/2.Graph_Gpio_D _1_5_4_OS.py (opens in a new tab) | Alternative live graph that opens /dev/gpiochip4 |
Save_data/Save_data_OS.py (opens in a new tab) | Save raw µV for all 16 channels to Excel (output3.xlsx) |
Save_data/1.Save_Data.py (opens in a new tab) | Save to Excel with a live graph. Use Save_data_OS.py if it gives gpiod errors. |
Save_data/command_line/pieeg_to_csv.py (opens in a new tab) | Command-line CSV recorder with duration, rate and gain options |
The graph and save scripts use the gpiod==1.5.4 package from PyPI. The command-line recorder uses a different GPIO library (see below). Older versions are kept in the arxive folders.
The save scripts write the file after a fixed number of samples (10000 = 40 seconds, 20000 = 80 seconds at 250 SPS). Change that number in the script to record longer or shorter.
Install the libraries
Recent Raspberry Pi OS blocks system-wide pip install, so use a virtual environment:
sudo apt install -y python3-venv python3-dev
python3 -m venv --system-site-packages ~/pieeg-env
source ~/pieeg-env/bin/activate
pip install spidev matplotlib scipy pandas openpyxl gpiod==1.5.4
Tested library versions (Python 3.11.2): matplotlib 3.6.3 · spidev 3.5 · scipy 1.10.1 · gpiod 1.5.4
Run
source ~/pieeg-env/bin/activate
git clone https://github.com/pieeg-club/PiEEG-16.git
cd PiEEG-16/GUI
python pieeg16_drdy_only.py
A window opens with the live graphs.
GPIO chip name. pieeg16_drdy_only.py opens GPIO chip "0", and some other scripts open gpiochip4. On a Raspberry Pi 4, use 0. On a Raspberry Pi 5, run gpiodetect and use the chip labelled pinctrl-rp1 (gpiochip0 on current Raspberry Pi OS, gpiochip4 on older releases). Change the gpiod.chip(...) line at the top of the script to match.
Command-line recorder
pieeg_to_csv.py records straight to CSV without a graph. It uses the system libgpiod bindings and RPi.GPIO rather than gpiod==1.5.4, so give it its own environment:
sudo apt install -y python3-libgpiod
python3 -m venv --system-site-packages ~/pieeg-cli-env
source ~/pieeg-cli-env/bin/activate
pip install spidev numpy RPi.GPIO      # on a Pi 5: pip install spidev numpy rpi-lgpio

cd PiEEG-16/Save_data/command_line
python pieeg_to_csv.py --fname session.csv --duration 600 --fs 250 --gain 1| Option | Default | Meaning |
|---|---|---|
--fname | required | Output CSV file |
--duration | 600 | Recording length in seconds |
--fs | 10 | Rate at which samples are written, in Hz. Set 250 to keep every sample. |
--gain | 1 | ADS1299 gain: 1, 2, 4, 6, 8, 12 or 24 |
This script reads on a timer rather than on DRDY, and its µV values assume gain 1. For full-rate, DRDY-timed recordings, use pieeg-server record or Save_data_OS.py.
Data tools
| Script | What it does |
|---|---|
Save_data/dataset_visualisation/1.Data_Vis_Graph_sep.py (opens in a new tab) | Plot each channel of a saved file in its own graph |
Save_data/dataset_visualisation/2.Data_Vis_Graph_All_in_one.py (opens in a new tab) | Plot all channels in one graph |
Save_data/dataset_visualisation/3. Vis_Alpha_Wavelet.py (opens in a new tab) | Alpha-band filter and wavelet view, for the eyes-closed test (needs pip install PyWavelets) |
Dataset/Remove_Spikes.py (opens in a new tab) | Remove rows with SPI glitch spikes from a saved file, keeping all 16 channels aligned |
The visualisation scripts are not real-time. Set the file path at the top of each script before running it.
Next
- Signals & Datasets: sample recordings and a machine-learning example
- Specification: data frames, registers and µV conversion for writing your own driver