Signals & Datasets
What real MicroBCI recordings look like, and open data to practise with. All recordings use dry electrodes, no gel, at 250 samples per second.
Example signals
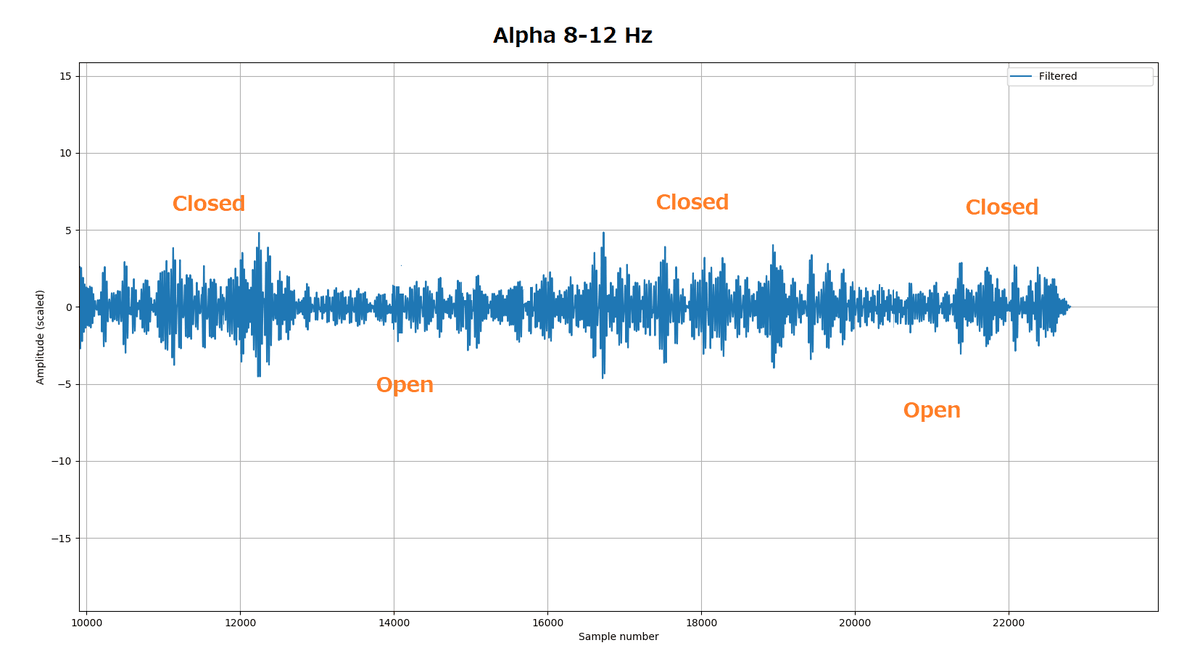
EEG: alpha test
Electrode at Fz, eyes closed and open in turn. Filtered to 8–12 Hz, so the alpha rhythm shows as bigger waves in the "closed" periods.
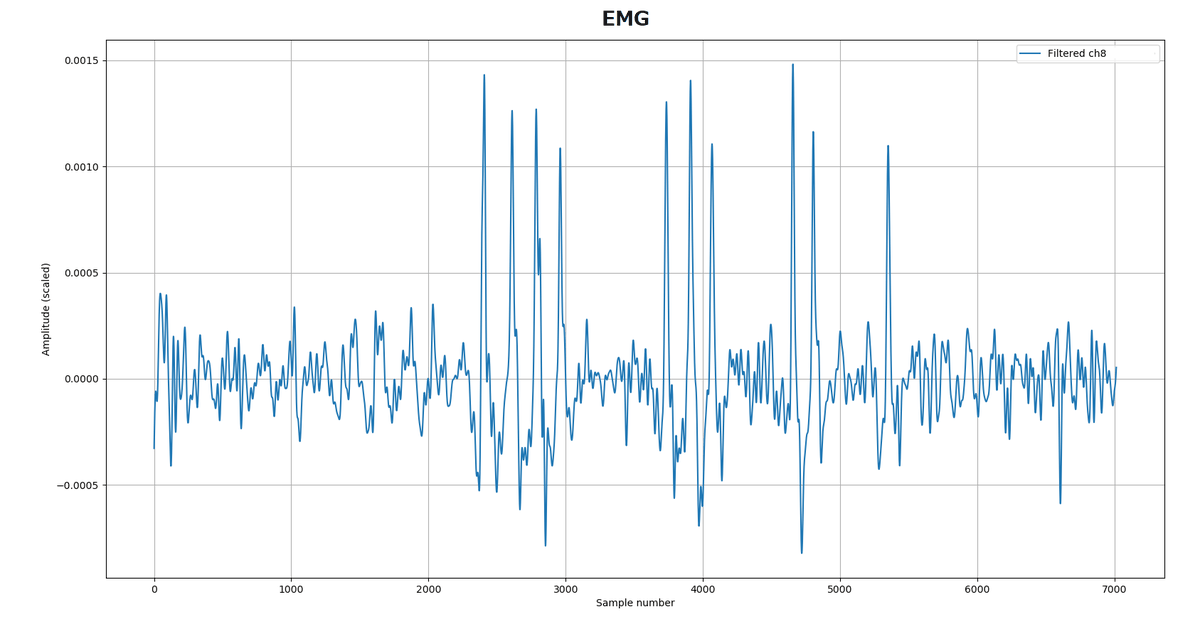
EMG: chewing
Electrode at Fz. Chewing 4, 3, 2 and 1 times. Filtered to 0.5–40 Hz.
EOG: blinking
Electrodes on the forehead. Blinking 4, 3, 2 and 1 times. Filtered to 0.5–40 Hz.
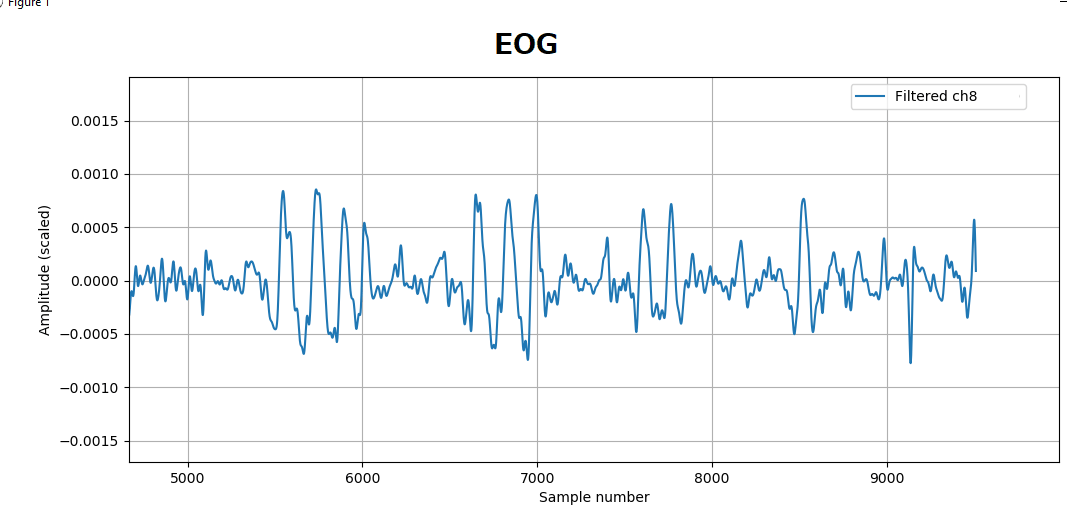
Chewing and blinking are muscle and eye signals, not brain activity. Learn to recognise them before you analyse EEG.
Datasets
In the Dataset (opens in a new tab) folder of the MicroBCI repository. CSV files with 8 columns (channels 1–8) and no header row, values in µV.
| File | Content | Size |
|---|---|---|
alpha_2ch.csv | Alpha test: eyes closed and open | 22,985 samples (about 92 s) |
EMG_Ch_8.csv | Chewing 4-3-2-1 times | 7,065 samples (about 28 s) |
EOG_Ch_8.csv | Blinking 4-3-2-1 times | 9,584 samples (about 38 s) |
The plots above each show one filtered channel. Filter the files and look through the channels to find the one with the clearest signal.
Plot them with 1.Band_pass.py (opens in a new tab) or 2.Band_pass_and_Wavelet.py (opens in a new tab). Because there is no header row, load them with pd.read_csv(file, header=None).
Raw values carry large DC offsets. Always apply a band-pass filter (for example 1–40 Hz, or 8–12 Hz for alpha) before looking at the signal.